Instrumentation-based Code Coverage
Introduction
This document describes how to enable and use LLVM instrumentation-based coverage,
via the -C instrument-coverage compiler flag.
How it works
When -C instrument-coverage is enabled, the Rust compiler enhances rust-based libraries and binaries by:
- Automatically injecting calls to an LLVM intrinsic (
llvm.instrprof.increment), at functions and branches in compiled code, to increment counters when conditional sections of code are executed. - Embedding additional information in the data section of each library and binary (using the LLVM Code Coverage Mapping Format Version 5, if compiling with LLVM 12, or Version 6, if compiling with LLVM 13 or higher), to define the code regions (start and end positions in the source code) being counted.
When running a coverage-instrumented program, the counter values are written to a profraw file at program termination. LLVM bundles tools that read the counter results, combine those results with the coverage map (embedded in the program binary), and generate coverage reports in multiple formats.
Note:
-C instrument-coveragealso automatically enables-C symbol-mangling-version=v0(tracking issue #60705). Thev0symbol mangler is strongly recommended. Thev0demangler can be overridden by explicitly adding-Z unstable-options -C symbol-mangling-version=legacy.
Enable coverage profiling in the Rust compiler
Rust’s source-based code coverage requires the Rust “profiler runtime”. Without it, compiling with -C instrument-coverage generates an error that the profiler runtime is missing.
The Rust nightly distribution channel includes the profiler runtime, by default.
Important: If you are building the Rust compiler from the source distribution, the profiler runtime is not enabled in the default
bootstrap.example.toml. Edit yourbootstrap.tomlfile and ensure theprofilerfeature is set it totrue(either under the[build]section, or under the settings for an individual[target.<triple>]):# Build the profiler runtime (required when compiling with options that depend # on this runtime, such as `-C profile-generate` or `-C instrument-coverage`). profiler = true
Building the demangler
LLVM coverage reporting tools generate results that can include function names and other symbol references, and the raw coverage results report symbols using the compiler’s “mangled” version of the symbol names, which can be difficult to interpret. To work around this issue, LLVM coverage tools also support a user-specified symbol name demangler.
One option for a Rust demangler is rustfilt, which can be installed with:
cargo install rustfilt
Compiling with coverage enabled
Set the -C instrument-coverage compiler flag in order to enable LLVM source-based code coverage profiling.
The default option generates coverage for all functions, including unused (never called) functions and generics. The compiler flag supports an optional value to tailor this behavior. (See -C instrument-coverage=<options>, below.)
With cargo, you can instrument your program binary and dependencies at the same time.
For example (if your project’s Cargo.toml builds a binary by default):
$ cd your-project
$ cargo clean
$ RUSTFLAGS="-C instrument-coverage" cargo build
If cargo is not configured to use your profiler-enabled version of rustc, set the path explicitly via the RUSTC environment variable. Here is another example, using a stage1 build of rustc to compile an example binary (from the json5format crate):
$ RUSTC=$HOME/rust/build/x86_64-unknown-linux-gnu/stage1/bin/rustc \
    RUSTFLAGS="-C instrument-coverage" \
    cargo build --example formatjson5
Note: that some compiler options, combined with
-C instrument-coverage, can produce LLVM IR and/or linked binaries that are incompatible with LLVM coverage maps. For example, coverage requires references to actual functions in LLVM IR. If any covered function is optimized out, the coverage tools may not be able to process the coverage results. If you need to pass additional options, with coverage enabled, test them early, to confirm you will get the coverage results you expect.
Running the instrumented binary to generate raw coverage profiling data
In the previous example, cargo generated the coverage-instrumented binary formatjson5:
$ echo "{some: 'thing'}" | target/debug/examples/formatjson5 -
{
    some: "thing",
}
After running this program, a new file named like default_11699812450447639123_0_20944 should be in the current working directory.
A new, unique file name will be generated each time the program is run to avoid overwriting previous data.
$ echo "{some: 'thing'}" | target/debug/examples/formatjson5 -
...
$ ls default_*.profraw
default_11699812450447639123_0_20944.profraw
You can also set a specific file name or path for the generated .profraw files by using the environment variable LLVM_PROFILE_FILE:
$ echo "{some: 'thing'}" \
    | LLVM_PROFILE_FILE="formatjson5.profraw" target/debug/examples/formatjson5 -
...
$ ls formatjson5.profraw
formatjson5.profraw
If LLVM_PROFILE_FILE contains a path to a nonexistent directory, the missing directory structure will be created. Additionally, the following special pattern strings are rewritten:
%p- The process ID.%h- The hostname of the machine running the program.%t- The value of the TMPDIR environment variable.%Nm- the instrumented binary’s signature: The runtime creates a pool of N raw profiles, used for on-line profile merging. The runtime takes care of selecting a raw profile from the pool, locking it, and updating it before the program exits.Nmust be between1and9, and defaults to1if omitted (with simply%m).%c- Does not add anything to the filename, but enables a mode (on some platforms, including Darwin) in which profile counter updates are continuously synced to a file. This means that if the instrumented program crashes, or is killed by a signal, perfect coverage information can still be recovered.
In the first example above, the value 11699812450447639123_0 in the generated filename is the instrumented binary’s signature,
which replaced the %m pattern and the value 20944 is the process ID of the binary being executed.
Installing LLVM coverage tools
LLVM’s supplies two tools—llvm-profdata and llvm-cov—that process coverage data and generate reports. There are several ways to find and/or install these tools, but note that the coverage mapping data generated by the Rust compiler requires LLVM version 12 or higher, and processing the raw data may require exactly the LLVM version used by the compiler. (llvm-cov --version typically shows the tool’s LLVM version number, and rustc --verbose --version shows the version of LLVM used by the Rust compiler.)
- You can install compatible versions of these tools via the
rustupcomponentllvm-tools-preview. This component is the recommended path, though the specific tools available and their interface is not currently subject to Rust’s usual stability guarantees. In this case, you may also findcargo-binutilsuseful as a wrapper around these tools. - You can install a compatible version of LLVM tools from your operating system distribution, or from your distribution of LLVM.
- If you are building the Rust compiler from source, you can optionally use the bundled LLVM tools, built from source. Those tool binaries can typically be found in your build platform directory at something like:
rust/build/x86_64-unknown-linux-gnu/llvm/bin/llvm-*.
The examples in this document show how to use the llvm tools directly.
Creating coverage reports
Raw profiles have to be indexed before they can be used to generate coverage reports. This is done using llvm-profdata merge, which can combine multiple raw profiles and index them at the same time:
$ llvm-profdata merge -sparse formatjson5.profraw -o formatjson5.profdata
Finally, the .profdata file is used, in combination with the coverage map (from the program binary) to generate coverage reports using llvm-cov report, for a coverage summaries; and llvm-cov show, to see detailed coverage of lines and regions (character ranges) overlaid on the original source code.
These commands have several display and filtering options. For example:
$ llvm-cov show -Xdemangler=rustfilt target/debug/examples/formatjson5 \
    -instr-profile=formatjson5.profdata \
    -show-line-counts-or-regions \
    -show-instantiations \
    -name=add_quoted_string
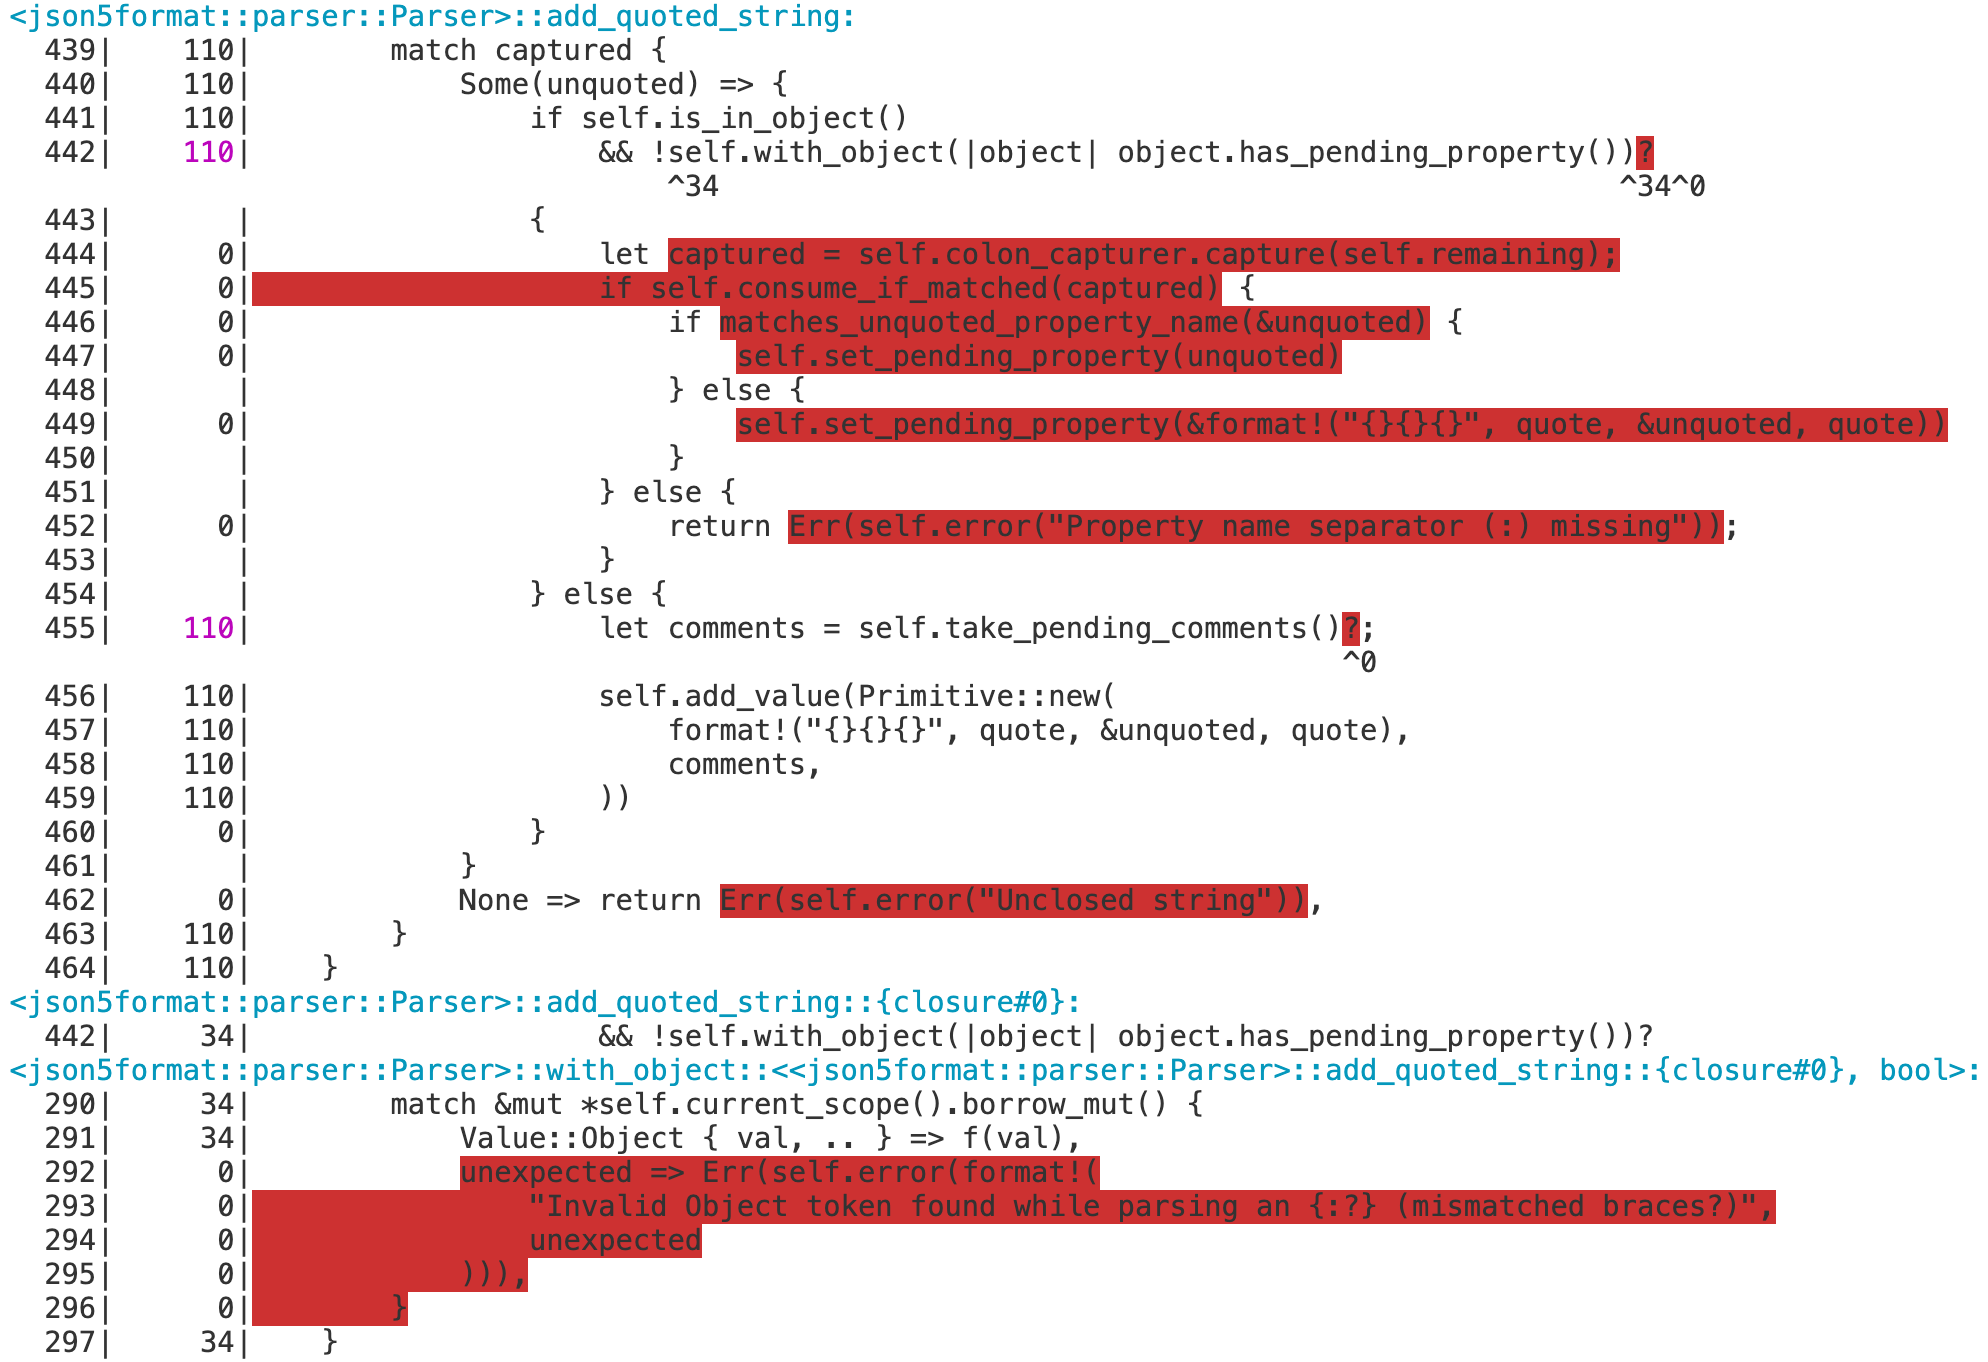
Some of the more notable options in this example include:
--Xdemangler=rustfilt- the command name or path used to demangle Rust symbols (rustfiltin the example)target/debug/examples/formatjson5- the instrumented binary (from which to extract the coverage map)--instr-profile=<path-to-file>.profdata- the location of the.profdatafile created byllvm-profdata merge(from the.profrawfile generated by the instrumented binary)--name=<exact-function-name>- to show coverage for a specific function (or, consider using another filter option, such as--name-regex=<pattern>)
Note: Coverage can also be disabled on an individual function by annotating the function with the [
coverage(off)attribute] (which requires the feature flag#![feature(coverage)]).
Interpreting reports
There are four statistics tracked in a coverage summary:
- Function coverage is the percentage of functions that have been executed at least once. A function is considered to be executed if any of its instantiations are executed.
- Instantiation coverage is the percentage of function instantiations that have been executed at least once. Generic functions and functions generated from macros are two kinds of functions that may have multiple instantiations.
- Line coverage is the percentage of code lines that have been executed at least once. Only executable lines within function bodies are considered to be code lines.
- Region coverage is the percentage of code regions that have been executed at least once. A code region may span multiple lines: for example, in a large function body with no control flow. In other cases, a single line can contain multiple code regions:
return x || (y && z)has countable code regions forx(which may resolve the expression, ifxistrue),|| (y && z)(executed only ifxwasfalse), andreturn(executed in either situation).
Of these four statistics, function coverage is usually the least granular while region coverage is the most granular. The project-wide totals for each statistic are listed in the summary.
Test coverage
A typical use case for coverage analysis is test coverage. Rust’s source-based coverage tools can both measure your tests’ code coverage as percentage, and pinpoint functions and branches not tested.
The following example (using the json5format crate, for demonstration purposes) show how to generate and analyze coverage results for all tests in a crate.
Since cargo test both builds and runs the tests, we set the additional RUSTFLAGS, to add the -C instrument-coverage flag.
$ RUSTFLAGS="-C instrument-coverage" \
    cargo test --tests
Note: The default for
LLVM_PROFILE_FILEisdefault_%m_%p.profraw. Versions prior to 1.65 had a default ofdefault.profraw, so if using those earlier versions, it is recommended to explicitly setLLVM_PROFILE_FILE="default_%m_%p.profraw"to avoid having multiple tests overwrite the.profrawfiles.
Make note of the test binary file paths, displayed after the word “Running” in the test output:
   ...
   Compiling json5format v0.1.3 ($HOME/json5format)
    Finished test [unoptimized + debuginfo] target(s) in 14.60s

     Running target/debug/deps/json5format-fececd4653271682
running 25 tests
...
test result: ok. 25 passed; 0 failed; 0 ignored; 0 measured; 0 filtered out

     Running target/debug/deps/lib-30768f9c53506dc5
running 31 tests
...
test result: ok. 31 passed; 0 failed; 0 ignored; 0 measured; 0 filtered out
You should have one or more .profraw files now, one for each test binary. Run the profdata tool to merge them:
$ llvm-profdata merge -sparse default_*.profraw -o json5format.profdata
Then run the cov tool, with the profdata file and all test binaries:
$ llvm-cov report \
    --use-color --ignore-filename-regex='/.cargo/registry' \
    --instr-profile=json5format.profdata \
    --object target/debug/deps/lib-30768f9c53506dc5 \
    --object target/debug/deps/json5format-fececd4653271682
$ llvm-cov show \
    --use-color --ignore-filename-regex='/.cargo/registry' \
    --instr-profile=json5format.profdata \
    --object target/debug/deps/lib-30768f9c53506dc5 \
    --object target/debug/deps/json5format-fececd4653271682 \
    --show-instantiations --show-line-counts-or-regions \
    --Xdemangler=rustfilt | less -R
Note: If overriding the default
profrawfile name via theLLVM_PROFILE_FILEenvironment variable, it’s highly recommended to use the%mand%pspecial pattern strings to generate unique file names in the case of more than a single test binary being executed.
Note: The command line option
--ignore-filename-regex=/.cargo/registry, which excludes the sources for dependencies from the coverage results._
Tips for listing the binaries automatically
For bash users, one suggested way to automatically complete the cov command with the list of binaries is with a command like:
$ llvm-cov report \
    $( \
      for file in \
        $( \
          RUSTFLAGS="-C instrument-coverage" \
            cargo test --tests --no-run --message-format=json \
              | jq -r "select(.profile.test == true) | .filenames[]" \
              | grep -v dSYM - \
        ); \
      do \
        printf "%s %s " -object $file; \
      done \
    ) \
  --instr-profile=json5format.profdata --summary-only # and/or other options
Adding --no-run --message-format=json to the same cargo test command used to run
the tests (including the same environment variables and flags) generates output in a JSON
format that jq can easily query.
The printf command takes this list and generates the --object <binary> arguments
for each listed test binary.
Including doc tests
The previous examples run cargo test with --tests, which excludes doc tests.1
To include doc tests in the coverage results, drop the --tests flag, and apply the
-C instrument-coverage flag, and some doc-test-specific options in the
RUSTDOCFLAGS environment variable. (The llvm-profdata command does not change.)
$ RUSTFLAGS="-C instrument-coverage" \
  RUSTDOCFLAGS="-C instrument-coverage -Z unstable-options --persist-doctests target/debug/doctestbins" \
    cargo test
$ llvm-profdata merge -sparse default_*.profraw -o json5format.profdata
The -Z unstable-options --persist-doctests flag is required, to save the test binaries
(with their coverage maps) for llvm-cov.
$ llvm-cov report \
    $( \
      for file in \
        $( \
          RUSTFLAGS="-C instrument-coverage" \
          RUSTDOCFLAGS="-C instrument-coverage -Z unstable-options --persist-doctests target/debug/doctestbins" \
            cargo test --no-run --message-format=json \
              | jq -r "select(.profile.test == true) | .filenames[]" \
              | grep -v dSYM - \
        ) \
        target/debug/doctestbins/*/rust_out; \
      do \
        [[ -x $file ]] && printf "%s %s " -object $file; \
      done \
    ) \
  --instr-profile=json5format.profdata --summary-only # and/or other options
Note: The differences in this
llvm-covinvocation, compared with the version without doc tests, include:
- The
cargo test ... --no-runcommand is updated with the same environment variables and flags used to build the tests, including the doc tests. - The file glob pattern
target/debug/doctestbins/*/rust_outadds therust_outbinaries generated for doc tests (note, however, that somerust_outfiles may not be executable binaries). [[ -x $file ]] &&filters the files passed on to theprintf, to include only executable binaries.
-C instrument-coverage=<options>
-C instrument-coverage=no(orn/off/false): Don’t enable coverage instrumentation. No functions will be instrumented for coverage.- This is the same as not using the
-C instrument-coverageflag at all.
- This is the same as not using the
-C instrument-coverage=yes(ory/on/true): Enable coverage instrumentation with the default behaviour. Currently this instruments all functions, including unused functions and unused generics.- This is the same as
-C instrument-coveragewith no value.
- This is the same as
Other values
-C instrument-coverage=all: Currently an alias foryes, but may behave differently in the future if more fine-grained coverage options are added. Using this value is currently not recommended.
-Z coverage-options=<options>
This unstable option is described in the Unstable Book.
Other references
Rust’s implementation and workflow for source-based code coverage is based on the same library and tools used to implement source-based code coverage in Clang. (This document is partially based on the Clang guide.)